Revised: 7/2020
This feature allows for the data range columns to include specific accounts defined by their account type and account dimensions also allowing for the ability to have one report column for salary accounts and another column to report fringe benefit accounts etc.
This option is similar to the cross tab report but allows each column to have a definition for a group of accounts.
1. Select Reports
2. Select Financial Reports
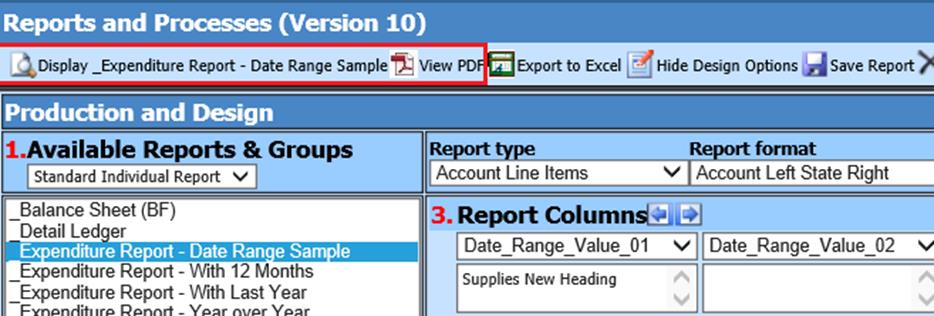
3. 1 Available Reports & Groups: Select Report
4. Select Design Options

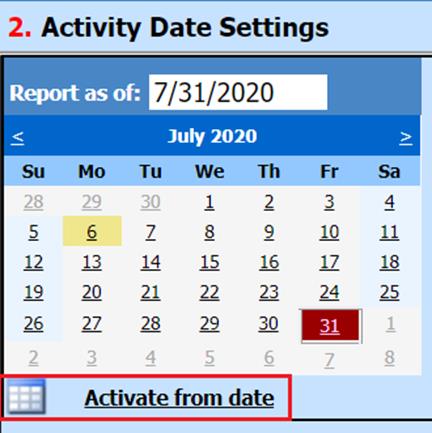
5. 2 Activity Date Settings: Select the dates needed for report.

6. 3 Report Columns: Choose the number of columns

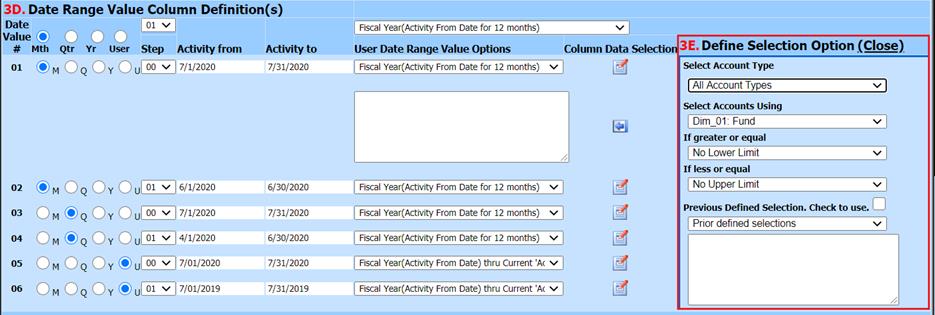
7. 3D Date Range Value Column Definitions (s)
Define the Date Value detail to display the Activity needed:
o Month, Quarter, Year, User defined
o Step
o Activity from, Activity to
o User Date Range Value Options
8. Select Column Data Selection for data selection to the right of the column

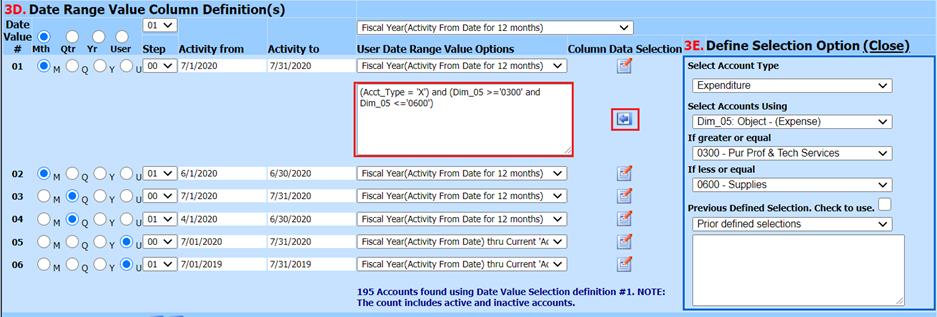
9. 3E Define Selection Option:

o Select Account type: All Account Types, Balance Sheet, Revenue, Expenditure or Revenue & Expenditure
o Select Accounts Using: Determine the Dimension to use in the selection criteria
o If greater or equal: Select the value
o If less or equal: Select the value
o Previous Defined Selection. Check to see: Display previous selections
10. Push the left arrow to put the SQL in the text box.

11. If more dimension selections are desired repeat steps 8-10
12. Before running the report you may want to change the column headings by selecting “Activate Column Heading Change”

13. 6 Save Report Definition:.

o To save report with a new name for futre use, change the name then select the save icon.
14. Display Report:

15. The report will display with the new name and new heading columns
