Revised: 7/2020
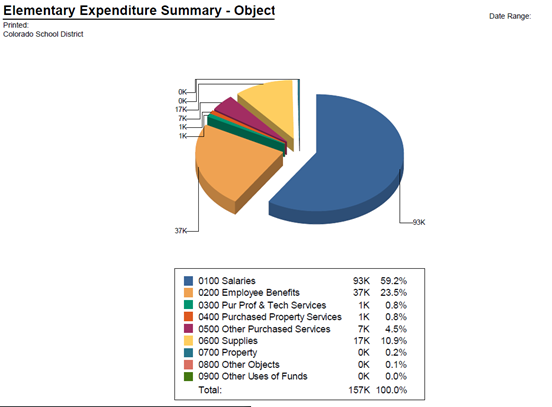
Charting is part of your Financial Report Design Area. You can graphically represent your district’s financial information as part of your regular financial reports.
To activate the sample Charting Reports
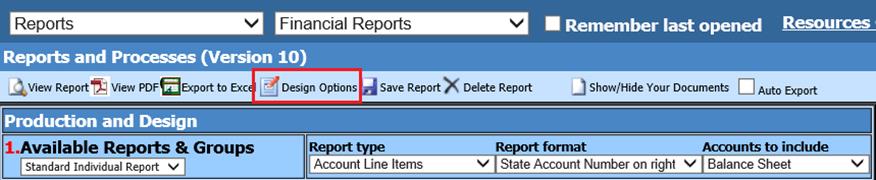
1. Select Reports
2. Select Financial Reports
3. Make sure the Design Options is activated
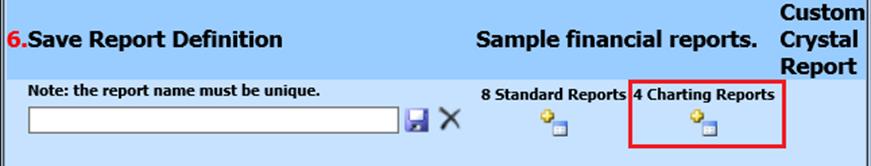
4. At the bottom of the page, select the button to load the sample charting reports.
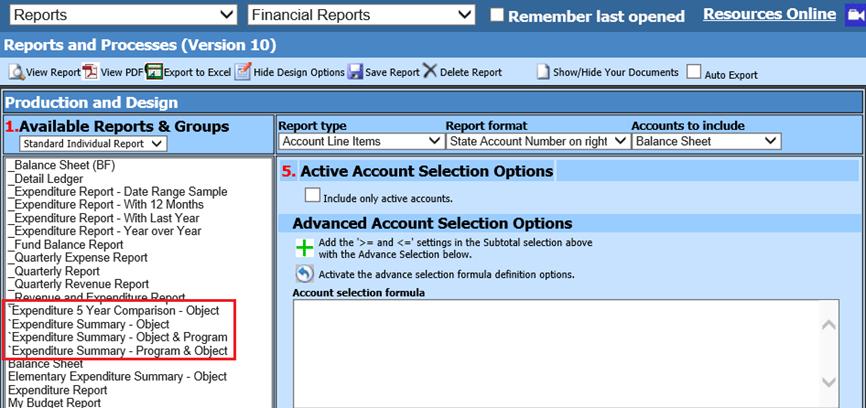
5. Four sample charting reports are now available to select from in your reports list. They are listed with the accent mark.
The Charting reports can be used with a Finance report you currently have customized and saved
1. Select the Report
2. Choose the Charting definitions desired in your report
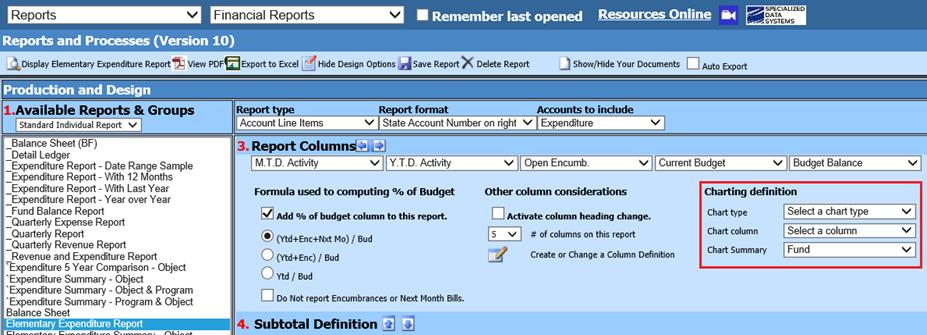
•Chart Type; There are several charts available: Bar, Pie or Doughnut charts
•Chart Column; Determine which column in your report you want to chart
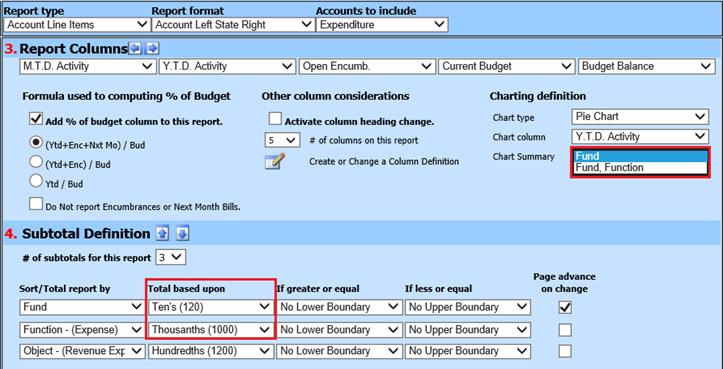
•Chart Summary; You can summarize on Fund or Fund, Function
o Summarizing by Fund: If using the Subtotal definitions, you can summarize using Full Code or by tens position
o Summarizing by Fund, Function: When using the Subtotal definitions, you can summarize or expand the Total Based Upon selections to preview the desired groupings of accounts. Viewing with Full Code, Ten’s, Hundredth’s, Thousand’s
3. Display the report
4. On the last page of the report, you will see the chart you have chosen