IMPORT TEST DATA
Click on the icon on the top row labeled “Import Test
Data”. Search this document for “Student Assessment Management (SAM) Reports”
for more instructions.
DEFINE A POPULATION
Click on the
icon on the top row labeled “Define a Population”. This will open up a screen to
allow you to select tables, fields and specific data for use in your assessment
reports. This will allow you to compare scores between different demographic
groups (i.e. gender, ethnic). You will need a general knowledge of what students
have been imported in order to define a meaningful population. For example, if
these are ACT scores for grade 12, you would not define a population of students
in grade 11.
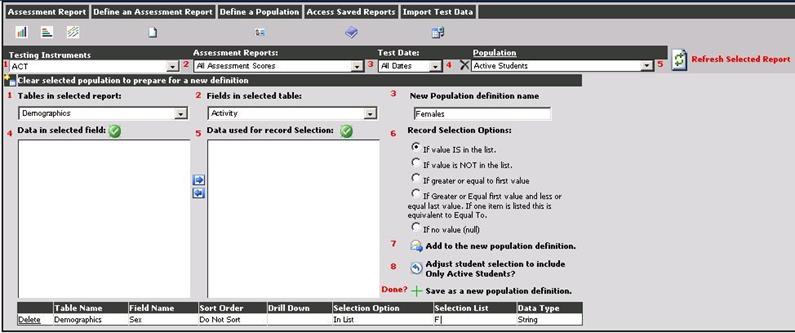
There are 8 steps on the screen labeled in red numerals. If
at any time you wish to clear what you have done in these steps or you have
saved a population and wish to create a new one, click on the icon above step 1
labeled “Clear Selected Population to Prepare for a new Definition”.
1. Tables in Selected Reports: Select a table (usually Demographics).
2. New Population definition name: Type in a name that describes the population you will be defining.
3. Fields in Selected Tables: Choose the field that you want to use for evaluation. For example, select the field “Sex”. The data available in this field will display in the left hand box.
4. Data in Selected Field: If you just want to see a report for females, put a check mark in front of “F” and then click the right arrow to move the selection to the right hand box.
5. Data Used for Record Selection: This is the right hand box that contains the selected field values.
6. Record Selection Options: Select the appropriate criteria for the data you have selected. Most often you will select the option “If value is in the list”.

7. Add to the New Population Definition: Once you have completed steps 1-6, you can add your selection to the population. You can repeat steps 3-6 if you want to further define your population.
8. Adjust student selection to include Only Active Students: Click this icon to include only current year active students in your population.
When all field and data
selections have been added, click the  to save the population using the name you
typed in step 2.
DEFINE AN ASSESSMENT REPORT
Click the icon
on the top row labeled “Define Assessment Report”. From the test data you
imported in step 1, create an assessment report for the test (i.e. ACT) and the
scores (i.e. English, Math) that you want to evaluate.
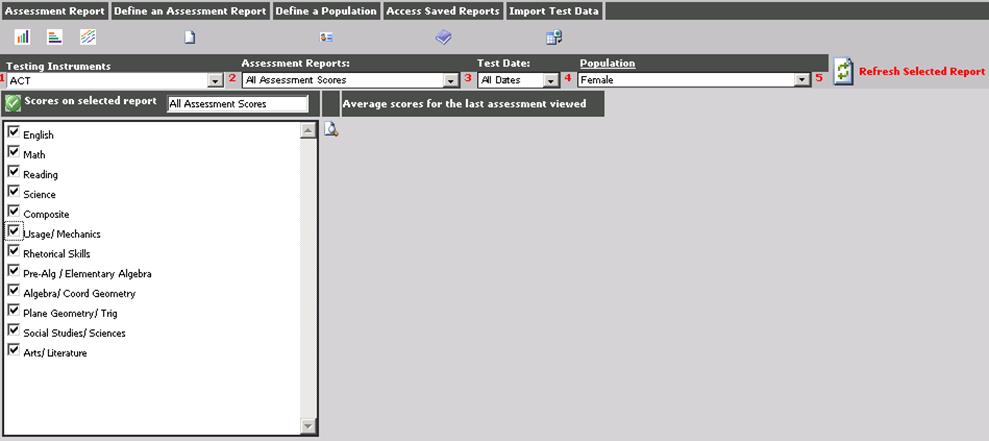
There are four
steps on the screen labeled in red numerals.
1. Testing Instrument: Click the dropdown and select a test that you have imported.
2. Assessment Reports: If no reports have yet been defined, there will be one item in the dropdown called “All Assessment Scores”. From this report you will be able to select scores and create a NEW report.
3. Test Date: If more than one testing date for a particular test has been imported to SAM, select the date of the test to be reported. If you want to include all scores that have been imported for this testing instrument, leave the dropdown at “All Dates”.
Population: If you have
previously defined a population it will appear in the dropdown. A default value
of “All active students” is in the dropdown if no other population is required.
For this example we will select the population “Female” in the previous
example.
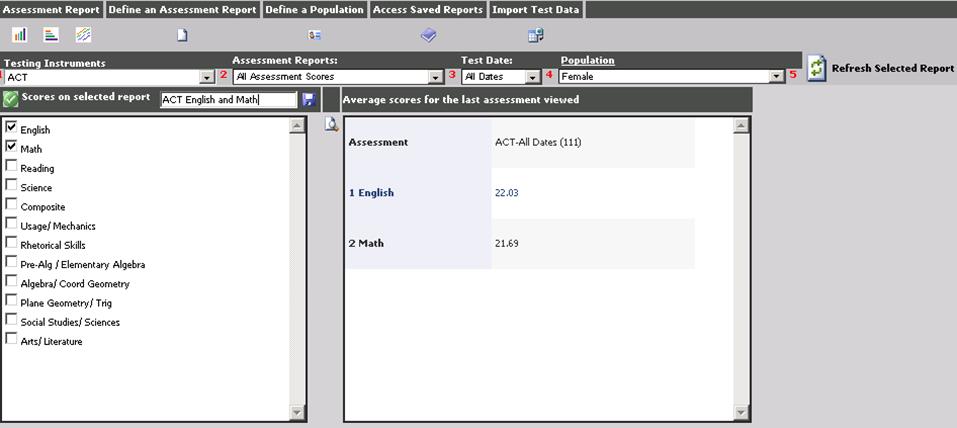
If you wish to define your own
custom report, type in a new report name in the box that contains “All
Assessment Scores”. For example, you just want English and Math so name the
report “ACT English and Math”.
Click the icon next to the selection box
to display the results of your report. If you wish to save this report, click
the Save icon next to your new report name and it will be available for future
use. When used later, you can define different populations and compare them side
by side.
ACCESS SAVED REPORTS. Click on the icon on the top row labeled “Access Saved
Reports”.
As stated above, you can now use your report to compare
several different populations. Let’s say you had previously created a population
called “Male” and you wish to look at English and Math Scores for both females
and males side by side. There are 5 steps to follow.
1. Select the ACT testing instrument.
2. All reports created on this instrument will be in the dropdown. This example shows the report that we created called “ACT English and Math”.
3. Select the test date.
4. Select the population “Male”.
5. Click the “Refresh Selected Report” icon to refresh the report data. Then click on one of the “charting” icons on the top row labeled “Assessment Report”. This example shows the vertical bar graph which is the icon on the far left.
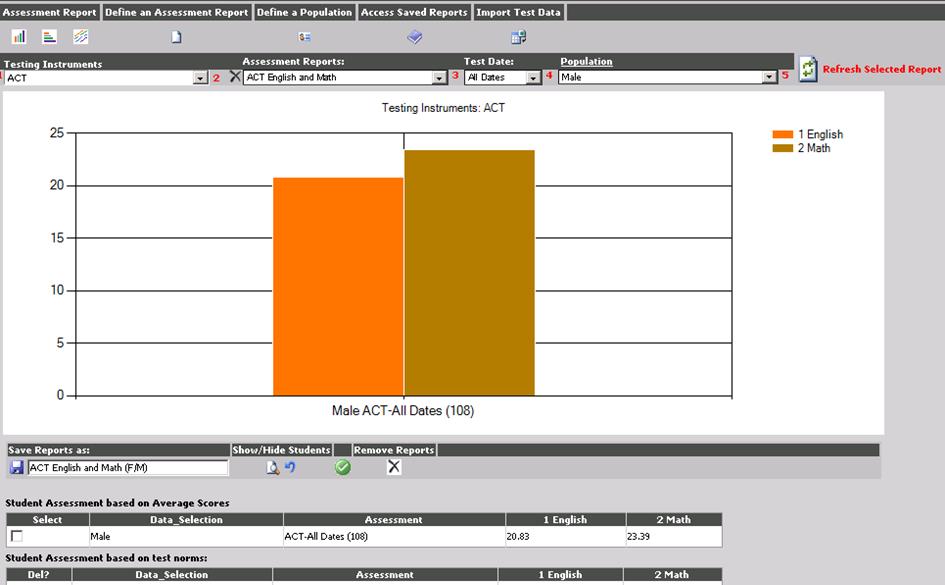
Then select
the population “Female” and click on the “Refresh Selected Report” icon.
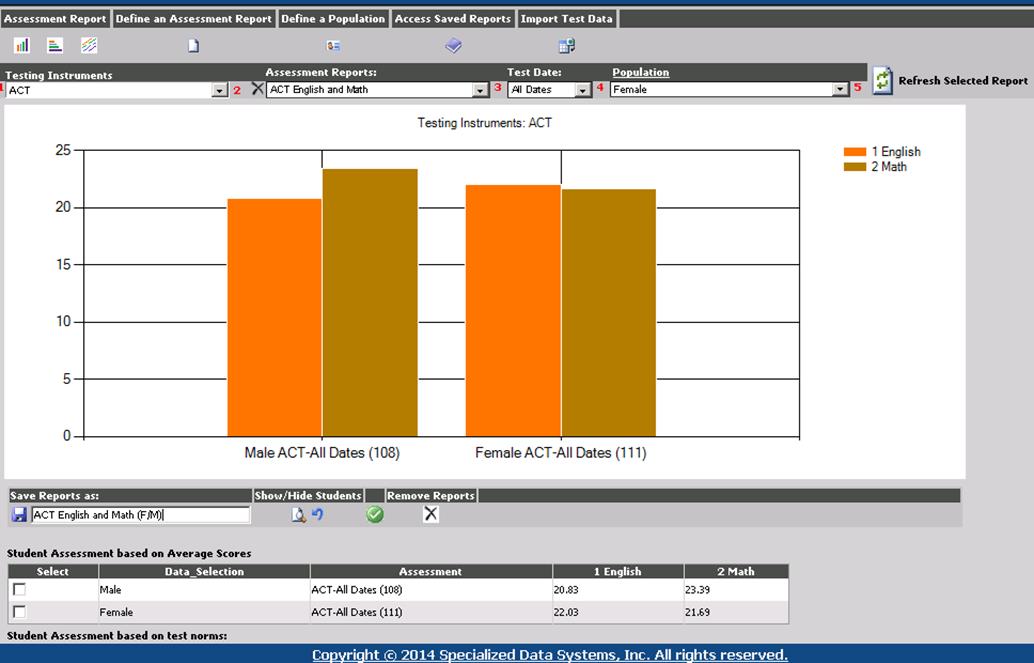
You
can save this report multiple times using different populations. For example,
you can save the report with just males selected as “ACT English and Math
(Males)” and save it with both males and females as “ACT English and Math
(M/F)”.
You can adjust the report on the fly by deleting a particular
population. For example, you want to remove the male population. Click the check
box next to the “Male” data selection and click the icon “Remove Report”.
You can also view the individual scores for each student in the
population(s) selected by clicking the icon “Show Hide Students”.
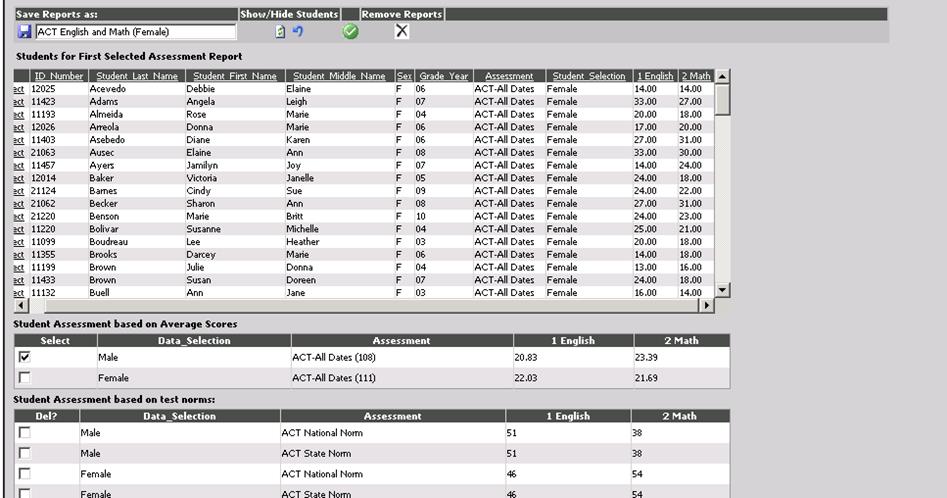
There are two assessments at the bottom of the
screen:
1. Student Assessment based on Average Scores: This is the average score on the selected test for the selected school population.
2. Student Assessment based on Test Norms: This shows how many students in the selected population scored below the average for both state and national norms. NOTE: These norms change each year and will need to be updated in your database. If you wish to receive this information, please contact SDS.