Revised: 7/2020
Financial Reporting is used to run basic, summary (i.e. fund, function and object) and detail finance reports (i.e. Expenditure, Revenue, Balance Sheet and many more.). You can design reports for comparisons, detail analysis, use special criteria and change report columns. These reports can also directly interface with the “Messaging Center” for report distribution.
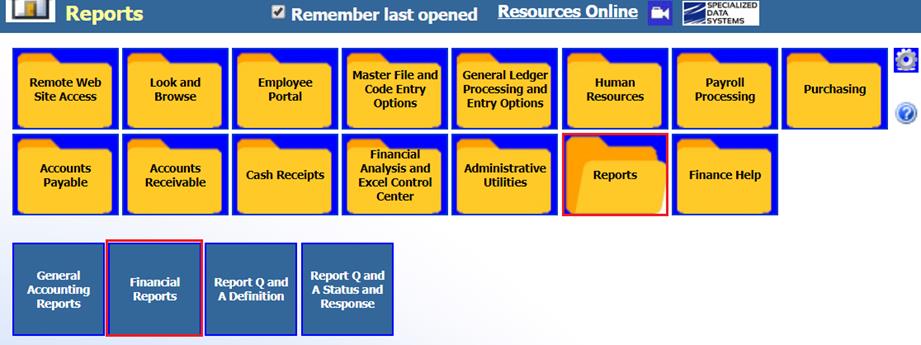
1. Select Reports
2. Select Financial Reports
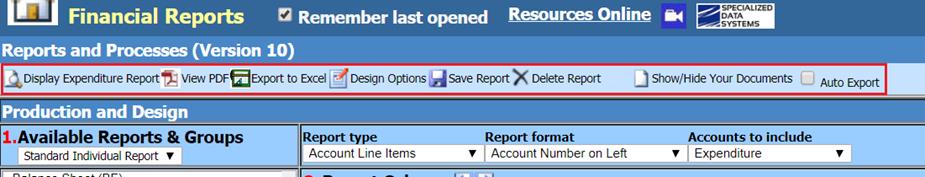
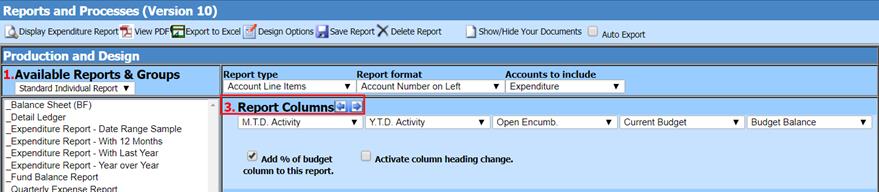
•Display Report: Will open the report in Crystal Report format
•View PDF: Will open the report in a PDF format
•Export to Excel: Will open the report in an Excel format. The workbook will display with several tabs, based on the report chosen.
o The dollar columns are not formatted as currency. They are formatted as numbers. If you wish, you can reformat them after the workbook displays.
o The report is showing every account used to create the report.
o The other tabs are summary reports, showing various levels of summary.
o If a summary report or cross tab report are run, the output will be the same as if a report is run to show every line number. Remember the summary is always part of this new report option.
o If a detail report is run, the account detail is not exported to the workbook. Only the line items and summary information are generated.
o If a number next to an account is changed, the totals on the report will not change. The totals area in the workbook is not a formula field.
•Design Options: Opens up other features that can be used for designing a report
•Save Report: Saves settings for the report
•Delete Report: Removes report selected from the list
•Auto Export: Will export the report into the “Show/Hide Your Documents” area for future referencing and/or printing.
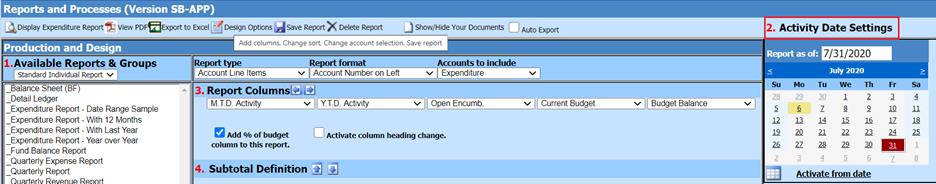
3. 1 Available Reports & Groups: Select Report
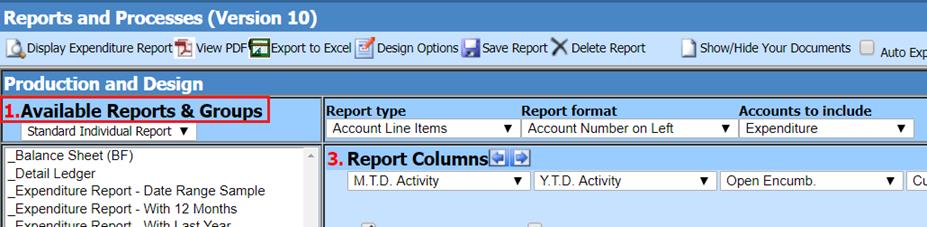
•Standard Individual Report: Default report
•Create a Report Group: Select and save up to 7 reports you wish to have run together as a group. See below link for more information: http://help.schooloffice.com/financehelp/#!Documents/financereportgroup1.htm
Financial Report Design options
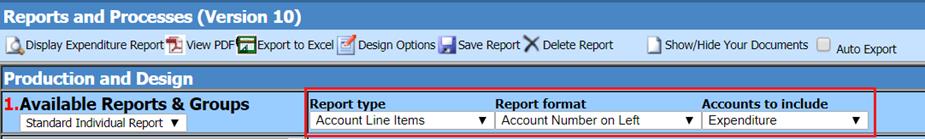
a. Report Type:
•Account Line Items: This view provides one line per account number for all accounts included in the report. No detail will be listed.
•Summary Report: This view provides a summary of accounts which have been selected for the report based on the subtotal definitions.
•Cross Tab Report: This view provides summary information in a crosstab format using the sort criteria selected for this report.
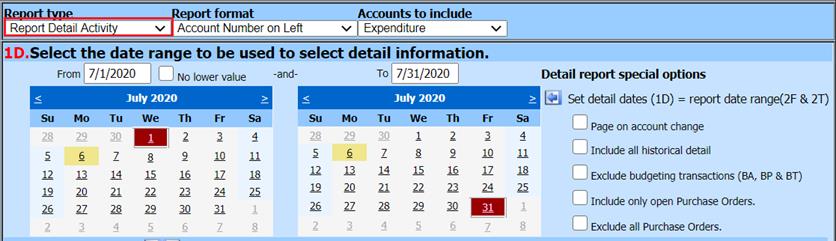
•Report Detail Activity: This view provides detail information for the date range selected. The dates showing above the detail calendars are based on the To and From Activity Date Settings calendars. Those can be adjusted as needed.
•Report Full Page Summary: This view provides summary of accounts which have been selected in the subtotal definitions.
b. Report Format
•The report format allows you to select where or if you want your ASN and State Account Numbers to appear on your report, you can also include any budgeting notes. From the drop down selection, select the report format you want for your report.
c. Accounts to include
•This dropdown selection is populated depending on which type of report you select from the Available Reports List. Expense and Revenue accounts can be ran on the same report and will show a net difference as the total.
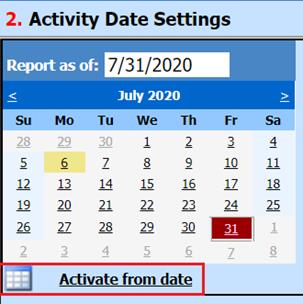
4. 2 Activity Date Settings: Select the dates needed for report.
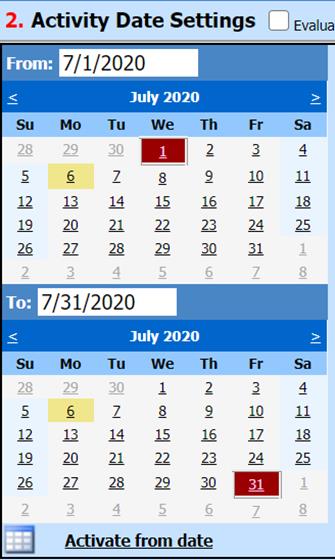
d. Activate from date: to activate a second date box to use a select date range for reporting
After selection of “Activate from date” two date range sections are now available
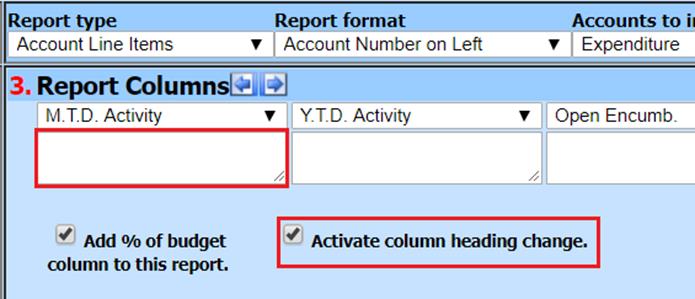
5. 3 Report Columns
e. Select the drop down selection next to any column title to choose another column for the report.
.
•Add % of budget column to this report: When check marked: determine the percentage criteria needed for reporting. There are three different ways you can have the percent of budget calculated:
o YTD Activity + Encumbrances + Next Month Activity divided by the budget
o YTD Activity + Encumbrances divided by the budget
o YTD Activity divided by the budget
•Activate column heading change: This option will allow you to title the column differently than the standard name defined
6. 4 Subtotal Definition
f. This selection will determine what dimensions the report will be subtotaling and how.
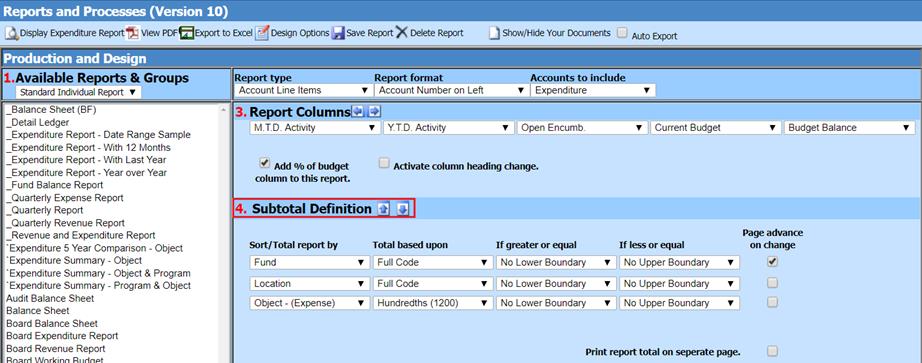
•Sort/Total report by: A list of all dimensions according to the report type that was selected. These dimensions can be changed by selecting the drop down selection.
•Total based upon: Contains a list of breakdowns per dimension the report can be subtotaled by. The breakdown of the dimension levels are found under: Budget Master, Dimension Code Add & Change view or State Codes (Fund Function, Object), Required Summary setup.
•If greater or equal / If less or equal: Select values to report on specific codes for the dimension. Either use the default values or select upper and lower values to display a smaller range of sort criteria.
o For example: if you want to report fund 10 – 40 select 10 in the “no lower boundary” field and 40 in the “no upper boundary” field. Once you stop out of the report area the report will go back to the default.
•Page advance on Change: If check marked, the report will page break on the dimension that is selected.
•Print report total on separate page: Report total will be on a page of its own.
g.
If an account selection was determined in the Subtotal Definition selection area
and you wish to save this formula, select the  . This will add the formula for the
criteria that is set, into the formula box.
. This will add the formula for the
criteria that is set, into the formula box.
Other column considerations
Once the Design Options has been activated, a new selection will display:
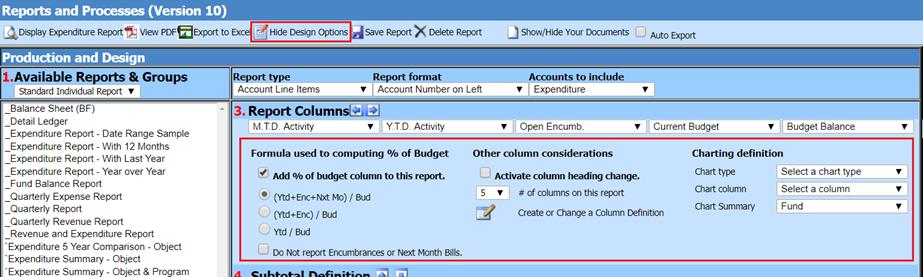
o Add % of budget column to this report: When check marked: determine the percentage criteria needed for reporting. There are three different ways you can have the percent of budget calculated:
§ YTD Activity + Encumbrances + Next Month Activity divided by the budget
§ YTD Activity + Encumbrances divided by the budget
§ YTD Activity divided by the budget
o # of columns on the report: Ability to choose the number of columns for the report. You can also use the blue arrows next to “Report Columns”
o Create or Change a Column Definition: Selecting this option you will see all the columns available to use for reporting under “Defined Columns”. To see the formula that is assigned to that title, select the column and the formula will appear in the large white box to the right. In this area you can create or modify current columns as well.
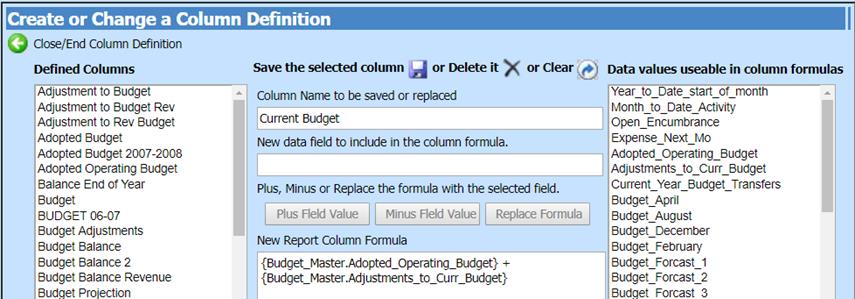
Note: It is suggested to use Date driven reporting, using the date range columns for your reporting. If any entries are made to a Prior Year, those column do not update. First_Yr_Prior field is the balance from Last Fiscal Year. Prior1_Ytd is the balances from the Last Month.
o Charting Definition:
§ Chart Type; There are several charts available: Bar, Pie or Doughnut charts
§ Chart Column; Determine which column in your report you want to chart
§ Chart Summary; You can summarize on Fund or Fund, Function
•Summarizing by Fund: If using the Subtotal definitions, you can summarize using Full Code or by tens position
•Summarizing by Fund, Function: When using the Subtotal definitions, you can summarize or expand the Total Based Upon selections to preview the desired groupings of accounts. Viewing with Full Code, Ten’s, Hundredth’s, Thousand’s
7. 5 Active Account Selection Options
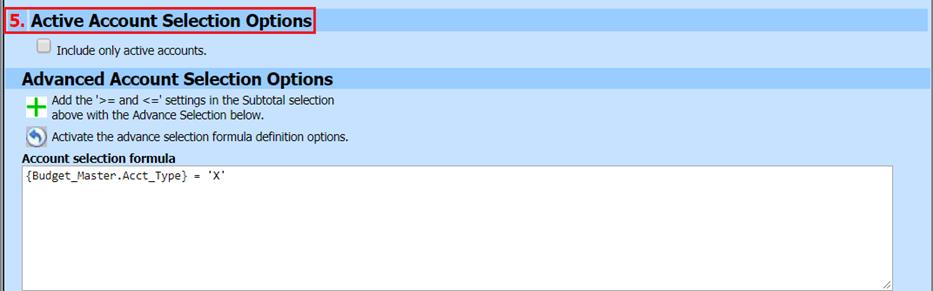
•Include only active accounts: This option allows you the select the activity of accounts to include on the report.
o Current YTD <>0: If checked, this will show accounts with activity displaying Less Than or Greater Than Zero, in the Current Fiscal Year..
o Last YTD <>0: If checked, this will show accounts with activity displaying Less Than or Greater Than Zero, in Last Fiscal Year
o Any Activity: If checked, this will show accounts with ANY activity displaying
o Acount_Status = ‘A’: If checked, this will show All Activie accounts with activity displaying.
•Advanced Account Selection Options: If criteria were set in
the Subtotal Definition area and you wish to apply it to the report select the
 . The formula for the
criteria that was set will go into the formula box, and then you can save the
report.
. The formula for the
criteria that was set will go into the formula box, and then you can save the
report.
•Activate the advance Selection Formula Definition Options  : This option allows you to
refine reports by selecting specific dimension ranges, account numbers, etc. The
sort builds on itself as you save each sort.
: This option allows you to
refine reports by selecting specific dimension ranges, account numbers, etc. The
sort builds on itself as you save each sort.
o Note: For example purposes we will design a report based on a specific object range for one location.
o Select the Activate Selection
Options. When the option is selected you will see the screen.
o S1 Fields in Selected Table: Select Object. Box S2 will fill with all your object numbers.
o S2 Data in Selected Field: Select your objects to query on. As you select your data, arrow it to the right into S3 Data used for Record Selection. You can Control/Click or Shift/Click to select a range of data.
§ For this example, select two objects that are apart from each other, such as Object 300 and 490 and arrow them to the right.
§ S4 Record Selection Options: Select If Greater or Equal first value and less or equal last value.
o Select Save New Sort
§ Follow the same process and select location from S1.
§ From S2, select a location and move it to the right into S3.
§ From the Record Selection Options: select, if value IS in the list. (=)
o Save New Sort.
o Close Sort Select.
Note: At any time in this process you can Clear Sort Definition and start over.
8. 6 Save Report Definition:
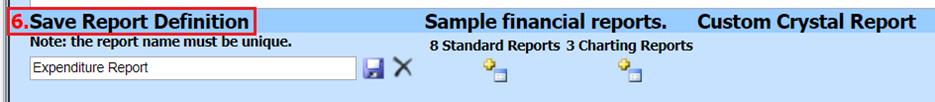
h. To save report with a new name for future use, change the name then select the
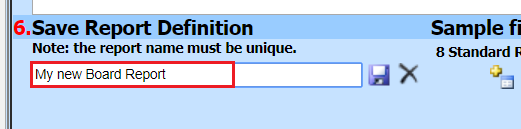
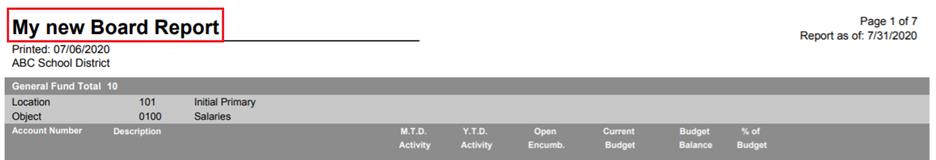
i. The name saved will display on printed reports.
Depending upon the state you reside, will determine the standard and charting reports available.
•8 Standard Reports: Choosing this icon will add the 8 standard reports to the list.
•3 Charting Reports: Choosing this will add the 3 standard charting reports to the list